Descriptors
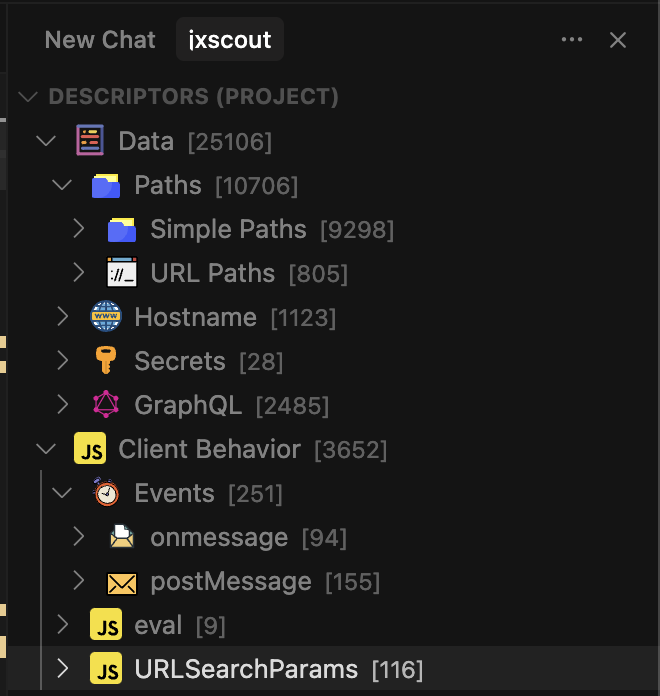
The descriptors view shows the findings discovered by jxscout in the JS files for your target. As jxscout discovers Webpack chunks, source maps and optimizes code, it will run the code through an analyzer that detects relevant pieces of code for security researchers.
Descriptors
This section provides an overview of all the descriptors that jxscout looks for:
- Data - static pieces of information
- Paths - path-like strings discovered in string literals
- Simple Paths - generic paths
- API Paths - paths that contain the keyword "api"
- URL Paths - paths that contain a protocol and domain name
- Paths with Query Params - paths that contain a query parameter
- Paths with Fragment - paths that contain a hash segment
- Hostname - hostname-like strings discovered in string literals
- Extensions - strings that contain an extension (e.g.
.html,.csv, etc) - MIME Type - strings that are a MIME Type (e.g.
application/json) - Regex - regex related findings
- Regex Match - code that is testing a regex for a match
- Regex Pattern - regex pattern found in the code
- Secrets - potential secrets found in the code
- Matches patterns in https://github.com/mazen160/secrets-patterns-db
- GraphQL - graphql related findings
- Query - graphql query
- Mutation - graphql mutation
- Other - other graphql findings (e.g. fragments)
- Paths - path-like strings discovered in string literals
- Frameworks - framework specific findings
- React - React related findings
- dangerouslySetInnerHTML - Usage of
dangerouslySetInnerHTML
- dangerouslySetInnerHTML - Usage of
- React - React related findings
- Client Behavior - relevant browser API calls
- Events - window events
- onmessage -
window.onmessageevent listeners - postMessage - postMessage calls
- onhashchange -
window.onhashchangeevent listeners
- onmessage -
- Location -
window.locationusages- Assignment -
window.locationassignments (e.g.window.location.href = 'mypayload$$$') - Read -
window.locationused as an expression
- Assignment -
- Storage - browser storage APIs usage
- Cookie - cookie related usage
- Assignment -
document.cookie = ... - Read -
document.cookieused as an expression
- Assignment -
- localStorage - usage of
localStorage - sessionStorage - usage of
sessionStorage
- Cookie - cookie related usage
- eval - usage of
evalin the code - document.domain - usage of
document.domain- Assignment -
document.domain = ... - Read -
document.domainused as an expression
- Assignment -
- window.name - usage of
window.name- Assignment -
window.name = ... - Read -
window.nameused as an expression
- Assignment -
- URLSearchParams - usage of
URLSearchParams - window.open - usage of
window.open - innerHTML - usage of
innerHTML - fetch - usage of
fetch - Possible Rest Client - calls to
.post(...),.patch(...),.get(...),.delete(...)that could be related to an API client
- Events - window events
- Dependency Confusion
- NPM Packages - discovered an NPM package name that could be used to check for dependency confusion (automated check is not implemented)
- Object Schemas - familiar object schemas
- Fetch Options - object that looks like a
fetchoption argument (e.g. includesmethod:,headers:, etc)
- Fetch Options - object that looks like a
Navigation
This section provides an overview of how to navigate descriptors.
Jumping to code locations
In the Descriptors view you will be able to jump to the code location where a specific descriptor was found. To do that just click on the descriptor you want to navigate to.
File Scope
The default scope for the descriptors view. In this mode only findings in the currently focused file on VSCode will be shown. If the current file is a HTML file, then findings across all the JS files (including reversed sources, discovered webpack chunks, and optimized versions) will be shown.
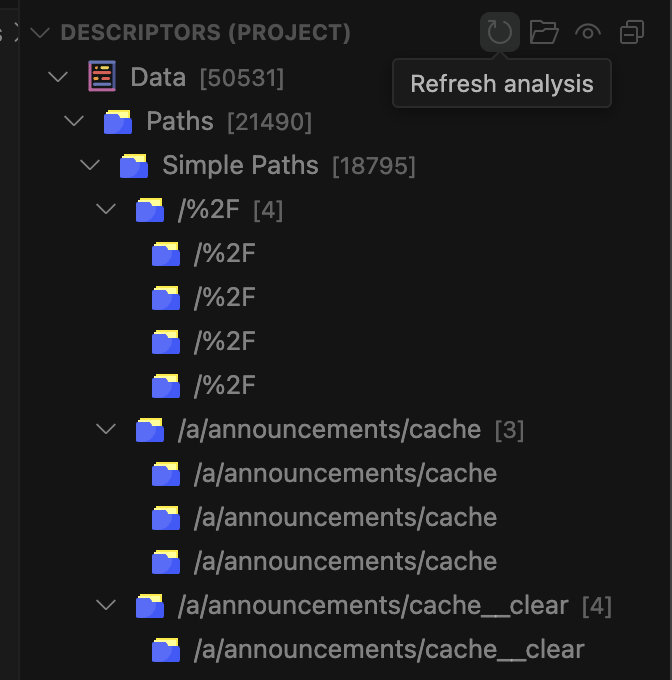
Project Scope
Instead of looking at the findings of individual files, you might want to look at all the findings across all the files on a target. To do that you can change to the Project level scope by clicking the folder icon on top of the Descriptors view.
In this mode, when you click on a finding the Descriptors view won't be updated, so this is a good way to jump between descriptors to check for interesting code.
Showing descriptors for multiple files
You might want to look for descriptors for a particular set of files, or hosts when analyzing JS. You can do this on jxscout by:
- Finding in the native VSCode file explorer the files/directories you want to analyze
- Selecting them by holding SHIFT or CTRL keys
- Right clicking and selecting "Show descriptors for selected files"
You can select multiple HTML files to get findings for all the loaded JS for that HTML file.
You can select multiple directories to get findings on all the files that were found recursively under those directories.
Locking the view
When using the File Scope, the Descriptors view will refresh every time you change to a different file. However, if you are analyzing the findings for a particular route, you might want to open up the HTML file for that route which will load all the findings across all the JS files loaded there, and keep the Descriptors view locked. That way you can jump between the descriptors on multiple files without having them refreshed.
To toggle the lock on the descriptors view, you can use the "lock icon" on top of the descriptors view.

Refreshing results
As of today, project level results are not updated automatically. To update the project level view to get the most up-to-date findings by jxscout, you can use the "Refresh Analysis" button on top of the view.
Hiding descriptor types
Not all descriptors might be useful for you or for the target you are working on. jxscout allows you to hide descriptors by right-clicking on the descriptor type you want to hide and clicking "Toggle Hide this Descriptor Type".
Searching descriptors
To filter out descriptors, you can use the search view. As you type, descriptors will be reloaded.